Modeling Traffic Accident Severity in Texas
Predicting traffic accident severity (2016–2023) using LightGBM, LDA, Random Forest and K-Means clustering.
Project overview. This project analyzes traffic accident severity in Texas (2016–2023) using a suite of machine-learning models. We compare interpretable linear baselines (Logistic Regression, LDA) against non-linear tree-based methods (Random Forest, LightGBM) and explore natural accident groupings using unsupervised K-Means clustering.
Introduction
Traffic accident severity is influenced by a complex web of interacting factors: weather conditions, time of day, road infrastructure and geographic location. Understanding these relationships is crucial for public safety and urban planning.
We predict accident severity on a scale of 1–4 (4 = most severe) using a Texas subset of the US Accidents dataset (over 580,000 records). The dataset has a heavy class imbalance dominated by “Severity 2” — a major modeling challenge.
Data preparation
We performed extensive cleaning to reduce noise and redundancy:
- Dimensionality reduction — drop sparse columns (e.g.
Weather_Timestamp) and low-variance features. - Feature engineering — extract
Start_Hour,Start_Month; standardize continuous variables.
The final dataset contained 116,568 samples after cleaning.
Methodology 1 — Linear baseline
We employed Logistic Regression and LDA, maximizing the probability of the correct class \(Y\) given features \(X\):
\[P(Y=k|X) = \frac{e^{\beta_k \cdot X}}{\sum_{j} e^{\beta_j \cdot X}}\]These models achieved a respectable ~77% accuracy, but their macro F1 was only 0.26 (Logistic) / 0.29 (LDA), revealing heavy bias toward the majority class.
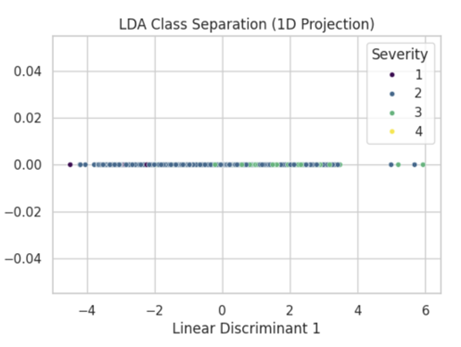
Figure 1: LDA 1D projection showing heavy overlap between Severity 2 and 3 — accident severity is not linearly separable.
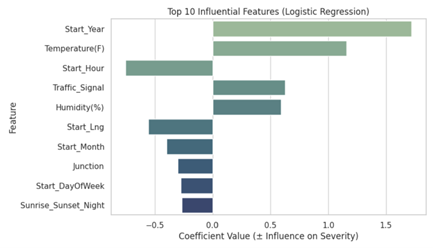
Figure 2: Feature importance for Logistic Regression. Start_Year and Temperature are strong positive predictors.
Methodology 2 — Capturing non-linearity
We compared Random Forest (bagging) with LightGBM (gradient boosting):
- Random Forest — 77% accuracy but predicted zero instances of Severity 1 and 4.
- LightGBM — top performer at 84.68% accuracy, with non-zero predictions for minority categories.
Feature importance shift
Where linear models focused on year and temperature, LightGBM identified geography as dominant.
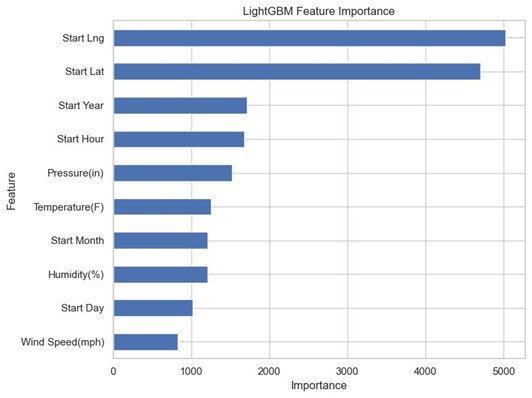
Figure 3: LightGBM feature importance — Start_Lng and Start_Lat are the most significant predictors.
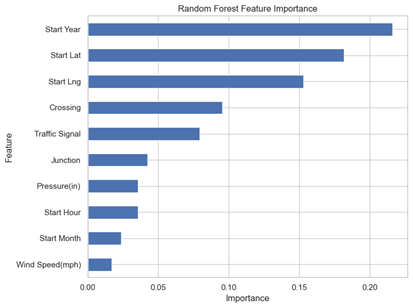
Figure 4: Random Forest prioritized temporal features (Start Year) over location.
Methodology 3 — Unsupervised clustering
To validate our supervised findings without label bias, we applied K-Means with PCA-reduced features and the elbow method (\(k=4\)). The clustering objective:
\[\min \sum_{i=1}^{k} \sum_{x \in C_i} \| x - \mu_i \|^2\]The four clusters separated naturally by weather regime: warm/dry, high-humidity/low-visibility (high-risk), and two mild groupings.
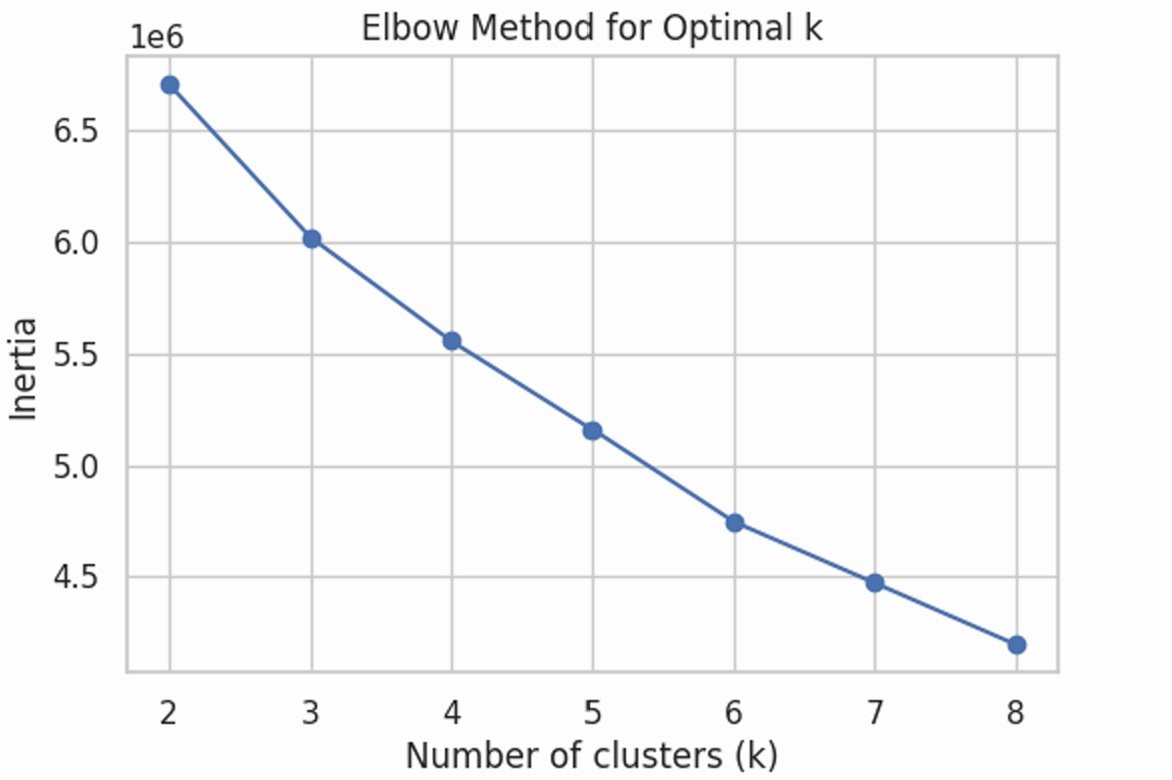
Figure 5: Elbow method used to select k = 4.
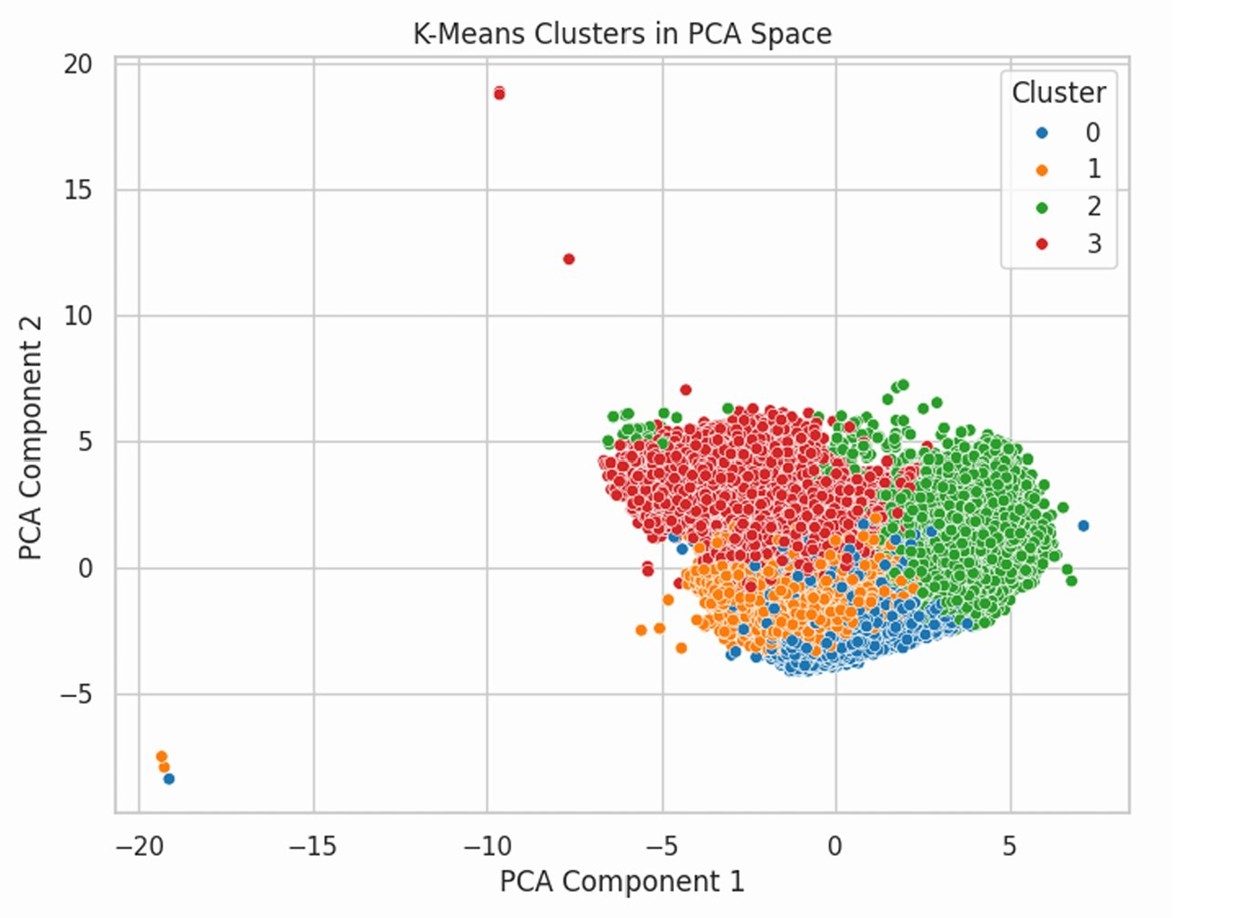
Figure 6: 4 clusters in PCA space — distinct separation of weather regimes.
Results summary
| Model | Accuracy | Weighted F1 | Macro F1 |
|---|---|---|---|
| Logistic Regression | 0.77 | 0.70 | 0.26 |
| LDA | 0.76 | 0.70 | 0.29 |
| Random Forest | 0.77 | 0.68 | 0.22 |
| LightGBM | 0.85 | 0.83 | 0.53 |
Key findings
- LightGBM superiority — outperforms all other models at 85% accuracy, capturing non-linear patterns linear and standard tree models miss.
- Location matters — the most accurate model finds spatial coordinates (lat/long) are the strongest predictors of severity.
- Weather-driven risk — unsupervised clustering confirms that high humidity + low visibility naturally form a “high-risk” profile, independent of severity labels.
- The imbalance problem — all models struggle with the rarest cases (Severity 4). Future work could explore SMOTE or specialized loss functions.