Project Overview: This project analyzes traffic accident severity in Texas (2016-2023) using a suite of machine learning models. We compare interpretable linear baselines (Logistic Regression, LDA) against non-linear tree-based methods (Random Forest, LightGBM) and explore natural accident groupings using unsupervised K-Means clustering.
Introduction
Traffic accident severity is influenced by a complex web of interacting factors: weather conditions, time of day, road infrastructure, and geographic location. Understanding these relationships is crucial for public safety and urban planning.
The goal of this project was to predict the severity of an accident on a scale of 1 to 4 (where 4 is most severe) and identify the key predictors driving these outcomes. We utilized a Texas-specific subset of the US Accidents dataset, containing over 580,000 accident records.
However, real-world data is rarely perfect. The dataset presented a massive class imbalance, where “Severity 2” accidents dominated the distribution. This posed a significant challenge for predictive modeling, requiring us to experiment with various architectures to balance accuracy with sensitivity to rare, severe events.
Data Preparation
Before modeling, we performed extensive cleaning to reduce noise and redundancy. This involved:
- Dimensionality Reduction: Dropping sparse columns (e.g.,
Weather_Timestamp) and low-variance features (e.g.,Bump,Give_Way). - Feature Engineering: Extracting temporal features like
Start_HourandStart_Month, and standardizing continuous variables (Temperature, Pressure) for linear models.
The final dataset contained 116,568 samples for training and testing after cleaning.
Methodology 1: The Linear Baseline
We began with interpretable linear models to establish a baseline and understand the direct linear relationships between features and severity.
Models: Logistic Regression & LDA
We employed Logistic Regression and Linear Discriminant Analysis (LDA). The objective was to maximize the probability of the correct class \(Y\)given features\(X\):
\[P(Y=k|X) = \frac{e^{\beta_k \cdot X}}{\sum_{j} e^{\beta_j \cdot X}}\]Performance
While these models achieved a respectable accuracy of ~77%, a deeper look at the metrics revealed a critical flaw. The models were heavily biased toward the majority class (Severity 2).
- Macro F1 Score: 0.26 (Logistic Regression) / 0.29 (LDA)
- Observation: The models failed to capture the decision boundaries for the minority classes (Severity 1 and 4).
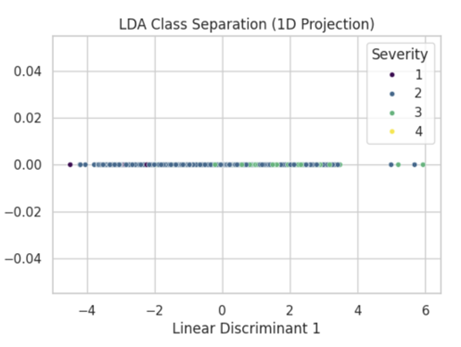 Figure 1: LDA 1D Projection showing heavy overlap between Severity 2 and 3, confirming that accident severity is not linearly separable.
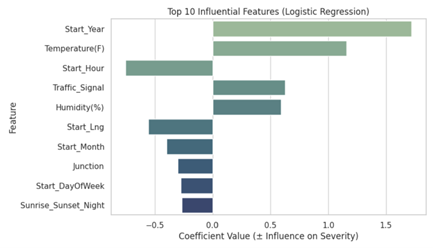 Figure 2: Feature Importance for Logistic Regression. Note that ‘Start_Year’ and ‘Temperature’ are strong positive predictors.
Methodology 2: Capturing Non-Linearity
To address the limitations of linear boundaries, we moved to tree-based ensemble methods capable of modeling complex, non-linear interactions.
Random Forest vs. LightGBM
We compared Random Forest (a bagging technique) against Light Gradient Boosting Machine (LightGBM).
- Random Forest: Achieved 77% accuracy. However, like the linear models, it struggled with the imbalance, predicting zero instances of Severity 1 and 4. It heavily favored the majority class.
- LightGBM: This was the top-performing model. It achieved an accuracy of 84.68% and, crucially, provided non-zero predictions for minority categories.
Feature Importance Analysis
The transition to non-linear models shifted the hierarchy of feature importance significantly. While linear models focused on Year and Temperature, LightGBM identified Geography as the dominant factor.
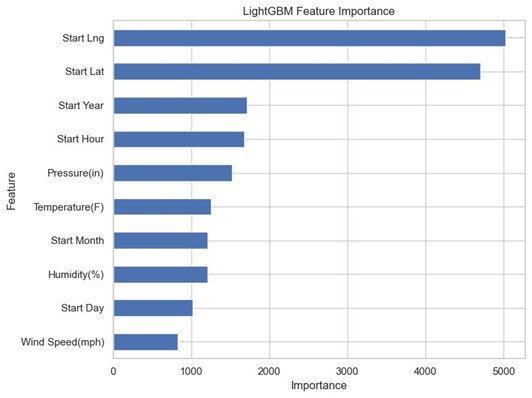 Figure 3: LightGBM Feature Importance. Start_Lng and Start_Lat (Location) are by far the most significant predictors.
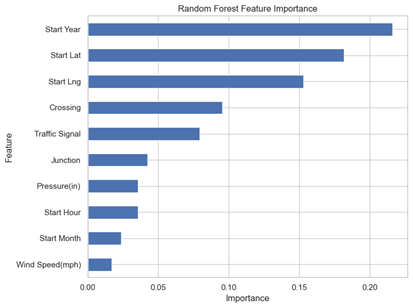 Figure 4: Random Forest Feature Importance. This model prioritized temporal features (Start Year) over location.
Methodology 3: Unsupervised Clustering
To validate our supervised findings without the bias of labels, we applied K-Means Clustering. We used Principal Component Analysis (PCA) to reduce the feature space and the Elbow Method to determine the optimal number of clusters (\(k=4\)).
The clustering objective was to minimize the within-cluster sum of squares (WCSS):
\[\min \sum_{i=1}^{k} \sum_{x \in C_i} \| x - \mu_i \|^2\]Cluster Insights
The algorithm identified four distinct natural groupings based largely on weather conditions:
- Cluster 1 (Warm/Dry): High correlation with Severity 2.3.
- Cluster 2 (High Risk): Characterized by high humidity and low visibility. This cluster had elevated severity levels.
- Clusters 0 & 3 (Mild): Normal conditions corresponding to lower average severity.
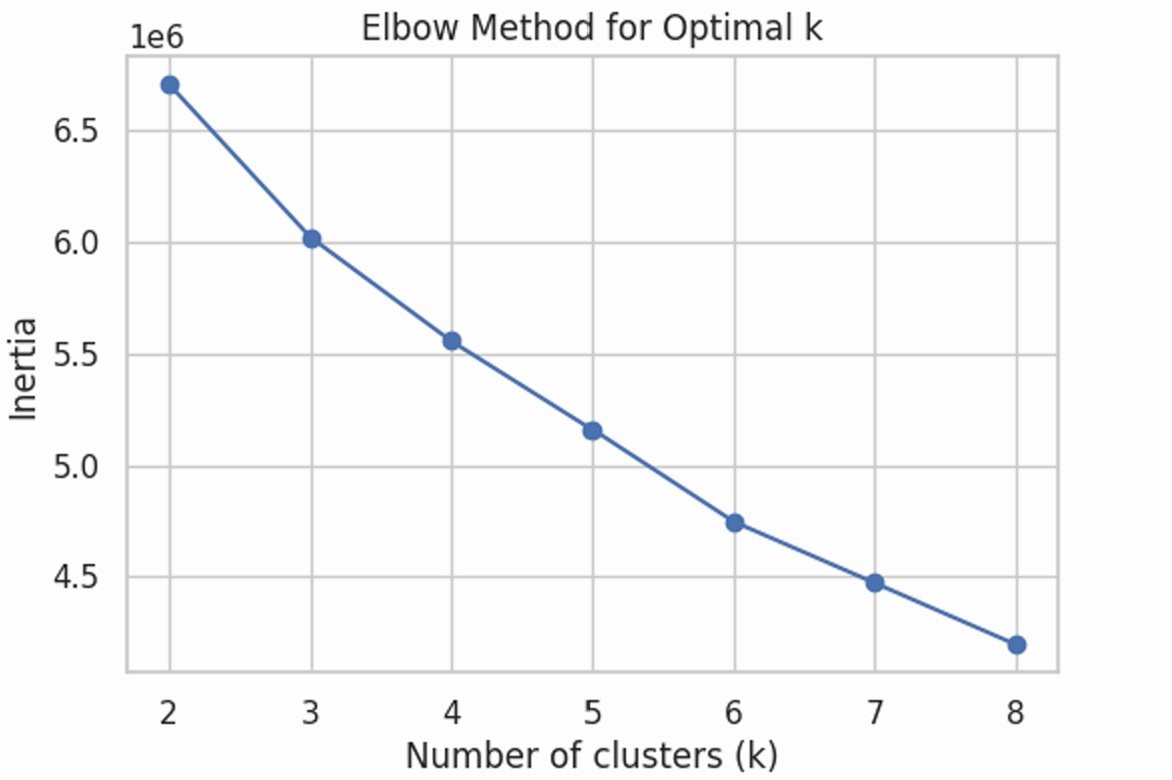 Figure 5: The Elbow Method used to select k=4 optimal clusters.
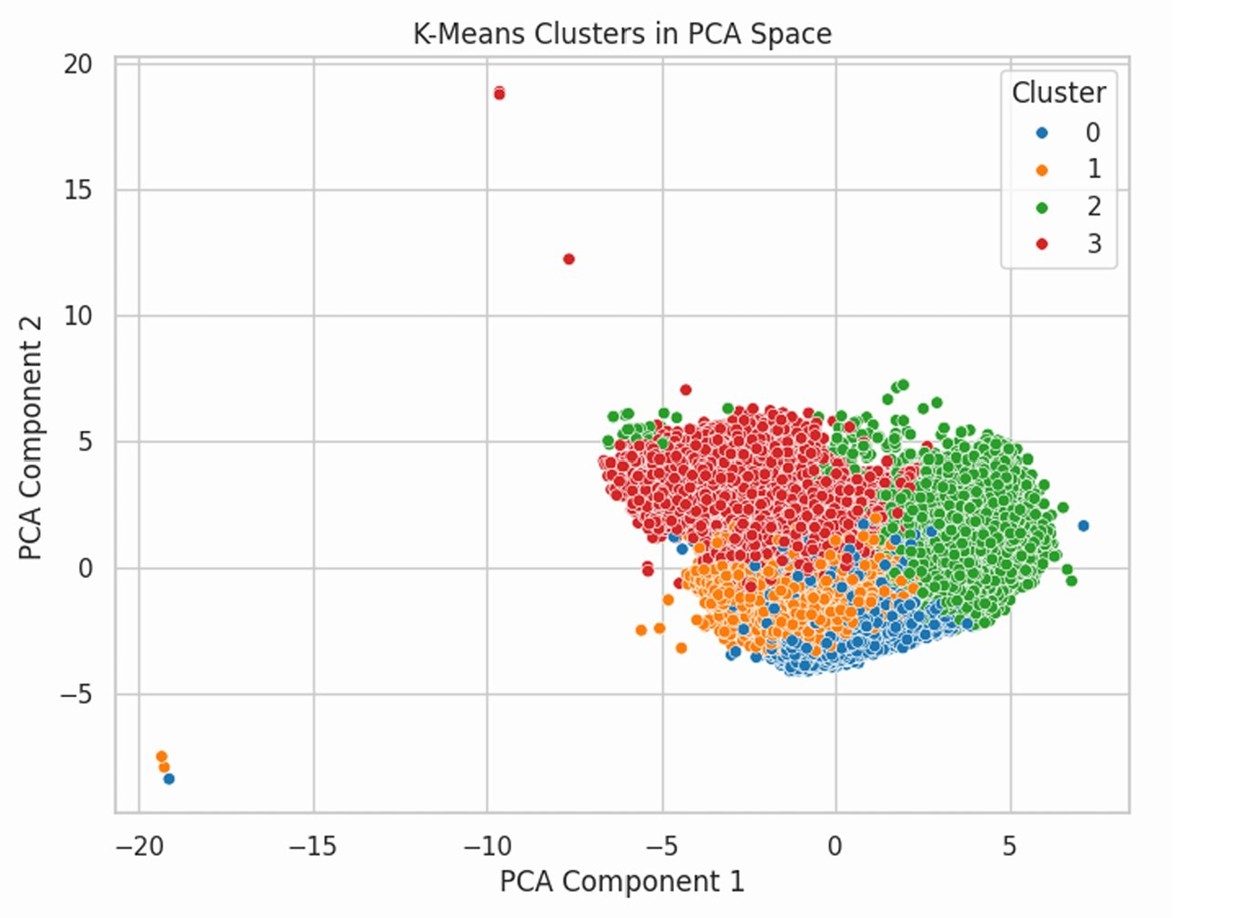 Figure 6: Visualization of the 4 clusters in PCA space. Note the distinct separation of weather regimes.
Results Summary
The table below summarizes the performance of all supervised models. LightGBM demonstrated superior capability in handling the dataset’s inherent imbalance.
| Model | Accuracy | Weighted F1 | Macro F1 |
|---|---|---|---|
| Logistic Regression | 0.77 | 0.70 | 0.26 |
| LDA | 0.76 | 0.70 | 0.29 |
| Random Forest | 0.77 | 0.68 | 0.22 |
| LightGBM | 0.85 | 0.83 | 0.53 |
Conclusion
This study highlights the specific challenges of modeling traffic accident data, particularly regarding class imbalance and non-linear relationships.
Key Findings:
-
LightGBM Superiority: LightGBM outperformed all other models (85% accuracy), effectively capturing non-linear patterns that linear models and standard Random Forests missed.
-
Location Matters: While linear models emphasized time and temperature, the most accurate model (LightGBM) found that spatial coordinates (Latitude/Longitude) are the strongest predictors of severity.
-
Weather-Driven Risk: Unsupervised clustering confirmed that High Humidity and Low Visibility naturally form a “high-risk” accident profile, independent of the severity labels.
-
The Imbalance Problem: Despite improvements, all models struggled with the rarest cases (Severity 4). Future work should focus on synthetic data generation (SMOTE) or specialized loss functions to better capture these critical edge cases.