Project Overview: This post details the development of Driver’s Assistant with Detection (D.A.D.), a computer vision system designed to reduce blind-spot accidents caused by visual impairment. We walk through the process of implementing the YOLOv1 architecture from scratch using Object-Oriented Programming (OOP) principles to create a lightweight, efficient detection model.
Introduction
According to the National Highway Transportation Safety Administration (NHTSA), 94% of all car accidents are related to human error. A significant portion of these incidents involves the nearly 20 million U.S. citizens living with visual impairments.
The most dangerous scenarios for these drivers often involve blind spots—areas where vehicles like buses, bikes, motorbikes, or other cars disappear from view.
This project aims to mitigate this risk by developing a detection system that alerts drivers to surrounding vehicles. By leveraging the speed of the You Only Look Once (YOLO) algorithm, we created a model capable of real-time inference on resource-constrained devices.
Methodology
1. The Algorithm: YOLOv1 from Scratch
Unlike multi-stage detectors that use region proposal networks, YOLO frames object detection as a single regression problem. We implemented YOLOv1 from scratch to ensure a deep understanding of the architecture and to optimize it for our specific use case.
The model divides an input image into an \(S \times S\)grid. If the center of an object falls into a grid cell, that cell is responsible for detecting it. The network predicts bounding boxes\(B\), confidence scores, and class probabilities simultaneously.
The loss function used is the Sum of Squared Error (SSE), calculated as:
\[Loss = \sum_{i=0}^{S^2} \text{CoordError} + \text{IoUError} + \text{ClassError}\]We rigorously handled the encoding and decoding of these bounding boxes to map predictions from the \(7 \times 7\)grid format back to the\(XYXY\) format required for visualization.
2. Lightweight Architecture
Efficiency was a primary goal. While standard detection models are often massive, our custom implementation focuses on minimizing parameter count without sacrificing utility.
- Total Parameters: 1.3 Million
- Storage Cost (FP32): ~5.2 MB
- Storage Cost (INT8): ~1.3 MB
This compact size makes D.A.D. highly suitable for embedded devices used in automotive settings.
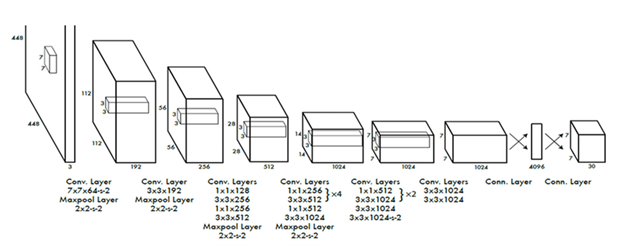 Figure 1: The custom YOLO architecture designed for the project.
3. Object-Oriented Design
To ensure scalability and maintainability, the project relies heavily on OOP principles. The codebase is modularized into distinct responsibilities:
dataset.py: Handles complex data loading, combining VOC2007 and VOC2012 datasets, and parsing XML annotations.model.py: Defines the neural network structure usingConvUnitandYoYoclasses.loss.py: Implements the custom SSE loss function with vectorized masking to replace slow loops.utils.py: Contains helper functions for Non-Max Suppression (NMS) and Mean Average Precision (mAP) calculation.
Experimental Setup
- Dataset: PascalVOC (Combined 2007 Train/Val/Test + 2012 Train/Val).
- Classes: Filtered for relevant road objects: Bicycle, Bus, Car, Motorbike.
- Input Resolution: \(224 \times 224\).
- Metric: Mean Average Precision (mAP@50).
Results
Training Convergence
We trained the model for 300 epochs. The loss curves demonstrate that the model successfully converged, with the training and validation loss decreasing steadily.
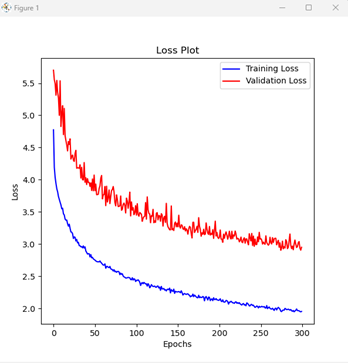 Figure 2: Training vs. Validation Loss over 300 epochs.
Similarly, the accuracy (mAP) improved consistently, showing that the model was learning to generalize well to unseen data within the validation set.
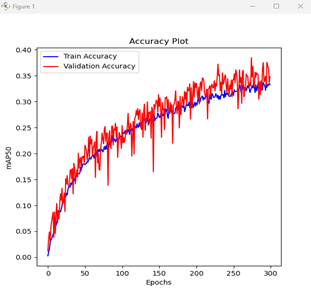 Figure 3: Mean Average Precision (mAP) increasing over time.
Inference Capabilities
We tested the model in two scenarios: static image inference and live webcam feeds.
Static Inference: The model successfully detects and classifies vehicles in standalone images with high confidence scores. The Non-Max Suppression (NMS) implementation effectively removes duplicate boxes.
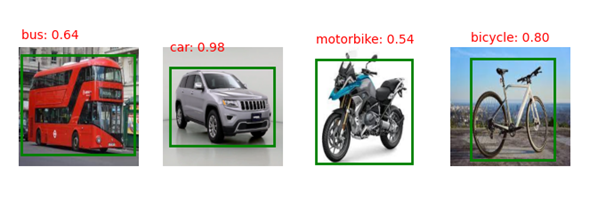 Figure 4: Single image inference on Bus, Car, Motorbike, and Bicycle.
Live Inference: We connected the model to a live webcam feed to simulate a driver’s perspective. While we encountered an OpenCV display bug that prevented bounding boxes from rendering on the live video stream, the command line interface successfully outputted correct class predictions and confidence scores in real-time.
Conclusion
The Driver’s Assistant with Detection (D.A.D.) project successfully demonstrated that a lightweight, OOP-based implementation of YOLOv1 can perform effective vehicle detection. With only 1.3 million parameters, the model balances accuracy with the efficiency required for real-world driving assistants.
Future work will focus on:
- Resolving the OpenCV live-rendering bug.
- Expanding the dataset to improve robustness in diverse lighting conditions.
- Further quantizing the model to reduce size for edge deployment.
By automating blind-spot monitoring, systems like D.A.D. have the potential to significantly improve road safety for visually impaired drivers.